Last updated: August 2, 2025
How to Create a Detrics Query in Google Sheets
This guide will walk you through the process of creating a comprehensive report in Google Sheets using Detrics.Before starting, make sure you have installed Detrics’ add-on and connected to
at least one data source. See our Google Sheets quickstart
guide for setup instructions.
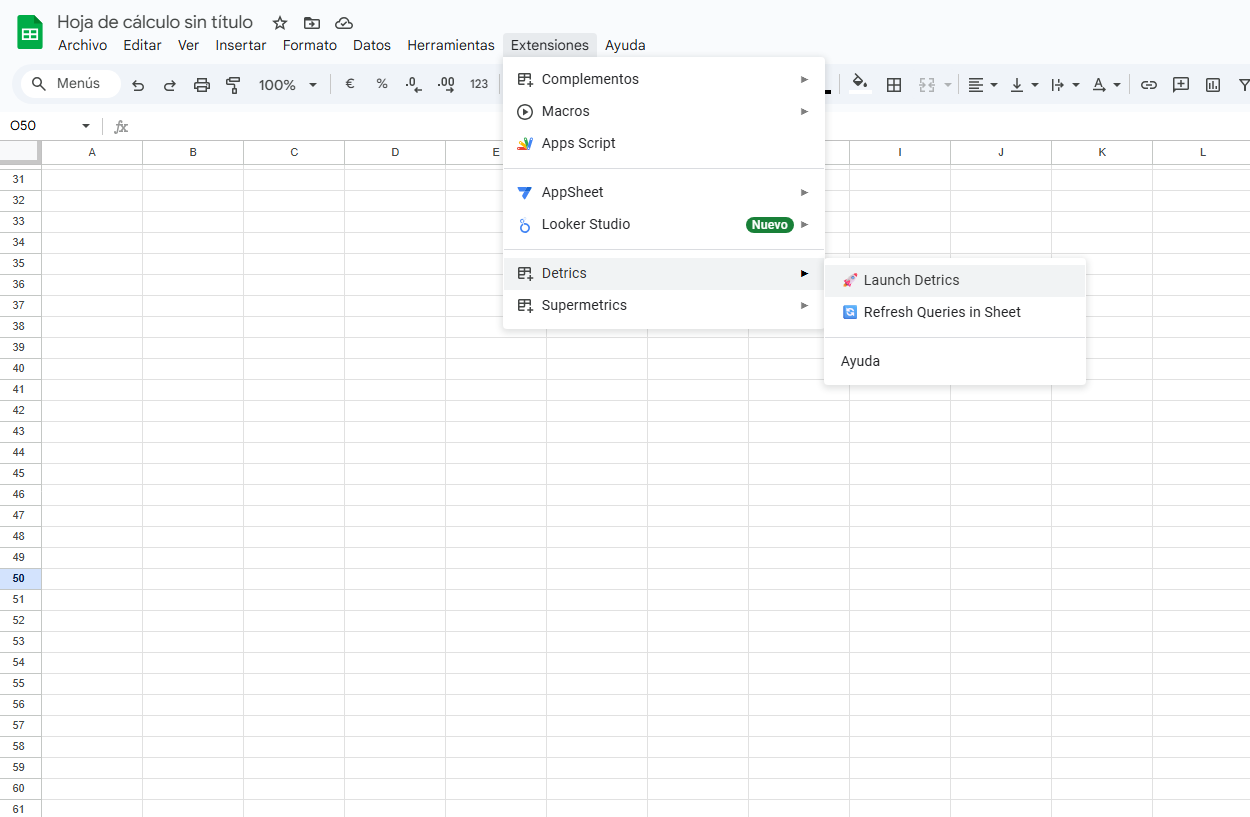
Step 1: Open Google Sheets and Launch Detrics
- Open a new Google Sheets document (click here to create one)
- Navigate to Extensions → Detrics → Launch sidebar
- The Detrics sidebar will appear on the right side of your sheet
Step 2: Select Your Data Source
- In the Detrics sidebar, click on Start from Scratch to create a Query from scratch or Start from Template to create a Query using Detrics’ pre-built templates
- Select the data source you want to use (e.g., Google Ads, Facebook Ads, etc.)
- If you haven’t connected this source yet, follow the authentication flow
Step 3: Configure Your Query
Choose Metrics and Dimensions
-
Select Metrics: Choose the metrics you want to include in your report
- Click on the metrics dropdown
- Select metrics like impressions, clicks, conversions, cost, etc.
- You can select multiple metrics for comprehensive reporting
-
Select Dimensions: Choose how you want to break down your data
- Common dimensions include date, campaign, ad group, etc.
- Dimensions help you segment and analyze your data
Set Date Range
- Click on the date range selector
- Choose from preset ranges (Last 7 days, Last 30 days, etc.) or set a custom range
- You can also use dynamic date ranges that update automatically
Apply Filters (Optional)
- Click on Add Filter to narrow down your data
- Select the field you want to filter by
- Choose the operator (equals, contains, greater than, etc.)
- Enter the filter value
Step 4: Choose Output Location
- Select where you want the data to appear in your spreadsheet
- The default location is cell A1 of the tab linked to the Query
- You can select a different location:
- Current cell location
- A different specific cell reference (e.g., B5)
Step 5: Run the Query
- Review your query configuration
- Click Run Query to fetch the data
- Detrics will populate your sheet with the requested data
Step 6: Format and Customize Your Report
Apply Formatting
- Select the data range
- Use Google Sheets formatting options:
- Apply number formats for currencies and percentages
- Add conditional formatting to highlight trends
- Adjust column widths for better readability
Create Charts and Visualizations
- Select your data
- Go to Insert → Chart
- Choose appropriate chart types:
- Line charts for trends over time
- Bar charts for comparisons
- Pie charts for proportions
Step 7: Set Up Automatic Refresh
- In the Detrics sidebar, click on the query you created
- Select Schedule Refresh
- Choose refresh frequency:
- Daily
- Weekly
- Monthly
- Custom schedule
- Set the specific time for refresh
- Click Save Schedule