> ## Documentation Index
> Fetch the complete documentation index at: https://support.detrics.io/llms.txt
> Use this file to discover all available pages before exploring further.
# Looker Studio Quickstart
> Connect Detrics to Looker Studio and create your first report
**Last updated:** March 21, 2026
This visual walkthrough shows you how to connect Detrics to Looker Studio and build your first dashboard, step by step. By the end, you will have a working report pulling live marketing data.
## Prerequisites
Before you begin, make sure you have:
* A [Detrics account](https://detrics.io/get-started?utm_source=detrics-support\&utm_medium=looker-quickstart) with at least one connected platform
* Access to [Looker Studio](https://lookerstudio.google.com) (free with any Google account)
## Connect and build your first report
Go to [lookerstudio.google.com](https://lookerstudio.google.com) and click **Blank Report** to start a new report, or open an existing one.
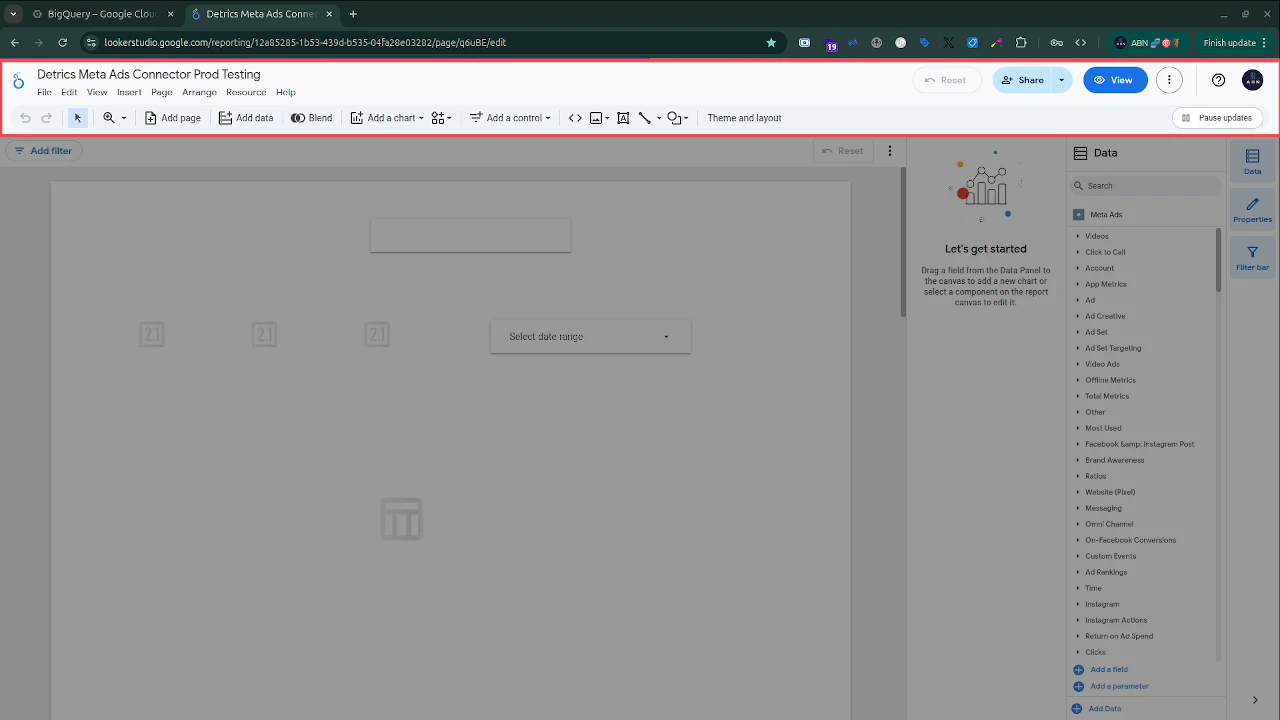
You will land in Edit mode with the toolbar across the top.
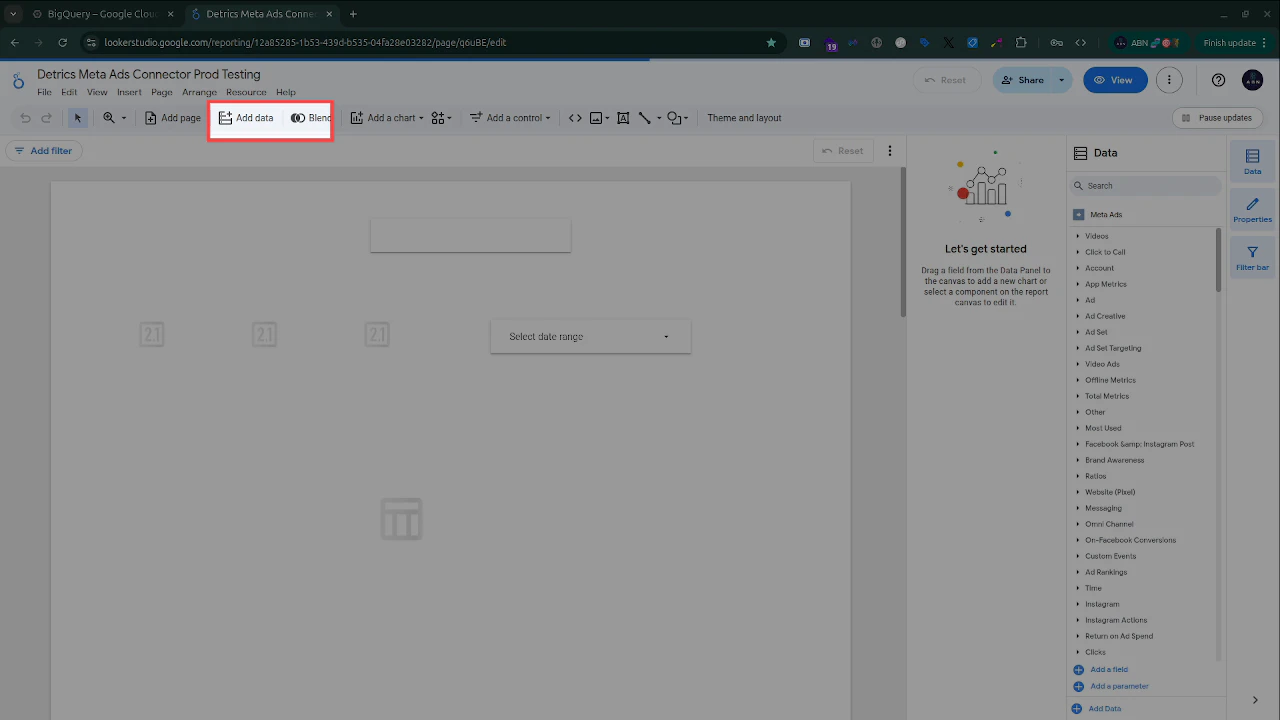
 Click **Add data** in the toolbar. In the connector search dialog, type **Detrics** and select the connector for your platform (e.g., "Detrics Meta Ads Connector").
Authorize the connection when prompted, then select the ad account you want to pull data from.
Click **Add data** in the toolbar. In the connector search dialog, type **Detrics** and select the connector for your platform (e.g., "Detrics Meta Ads Connector").
Authorize the connection when prompted, then select the ad account you want to pull data from.
 First time connecting? See the detailed [Add the Detrics Connector](/looker-studio/add-connector) guide for the full authorization flow with screenshots.
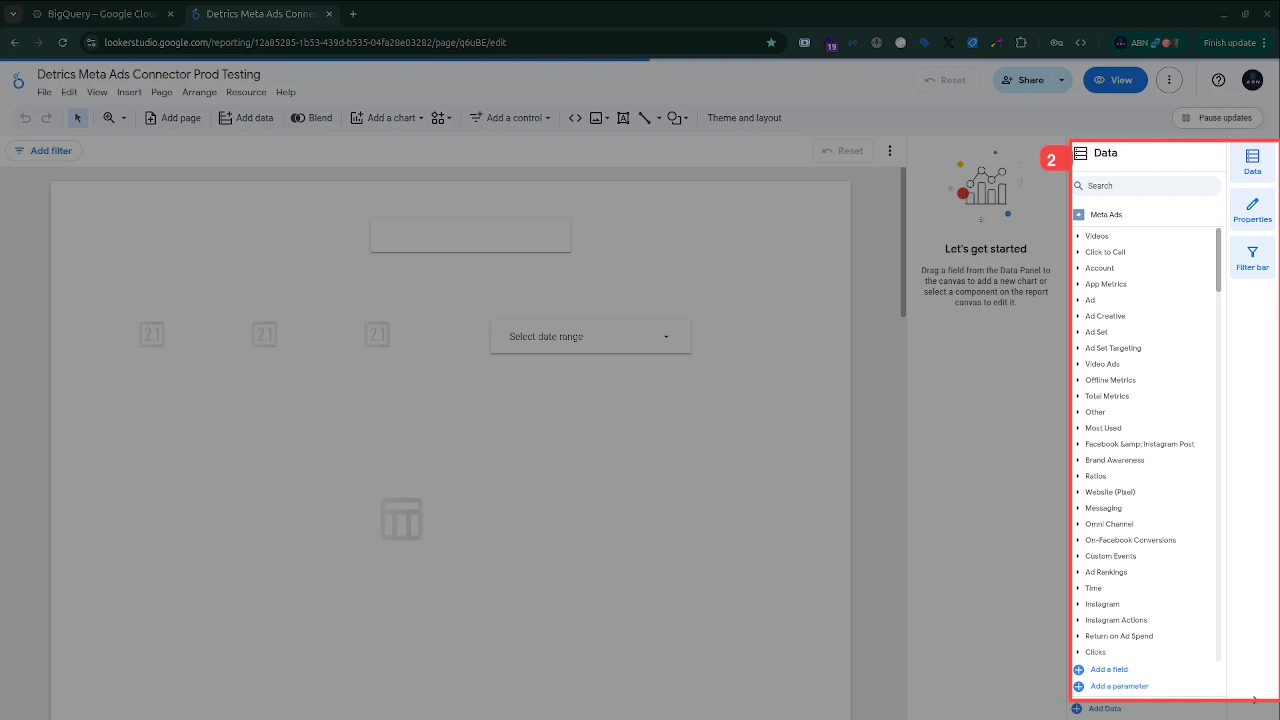
Once connected, the **Data panel** on the right shows all available fields organized into categories. For Meta Ads, you will see groups like Account, Ad, Ad Set, Ad Creative, Videos, Clicks, Total Metrics, and many more.
Expand any category to see individual fields. In Looker Studio, **dimensions** are attributes you group by (like Campaign Name or Date) and **metrics** are numeric values you measure (like Cost or Impressions).
First time connecting? See the detailed [Add the Detrics Connector](/looker-studio/add-connector) guide for the full authorization flow with screenshots.
Once connected, the **Data panel** on the right shows all available fields organized into categories. For Meta Ads, you will see groups like Account, Ad, Ad Set, Ad Creative, Videos, Clicks, Total Metrics, and many more.
Expand any category to see individual fields. In Looker Studio, **dimensions** are attributes you group by (like Campaign Name or Date) and **metrics** are numeric values you measure (like Cost or Impressions).
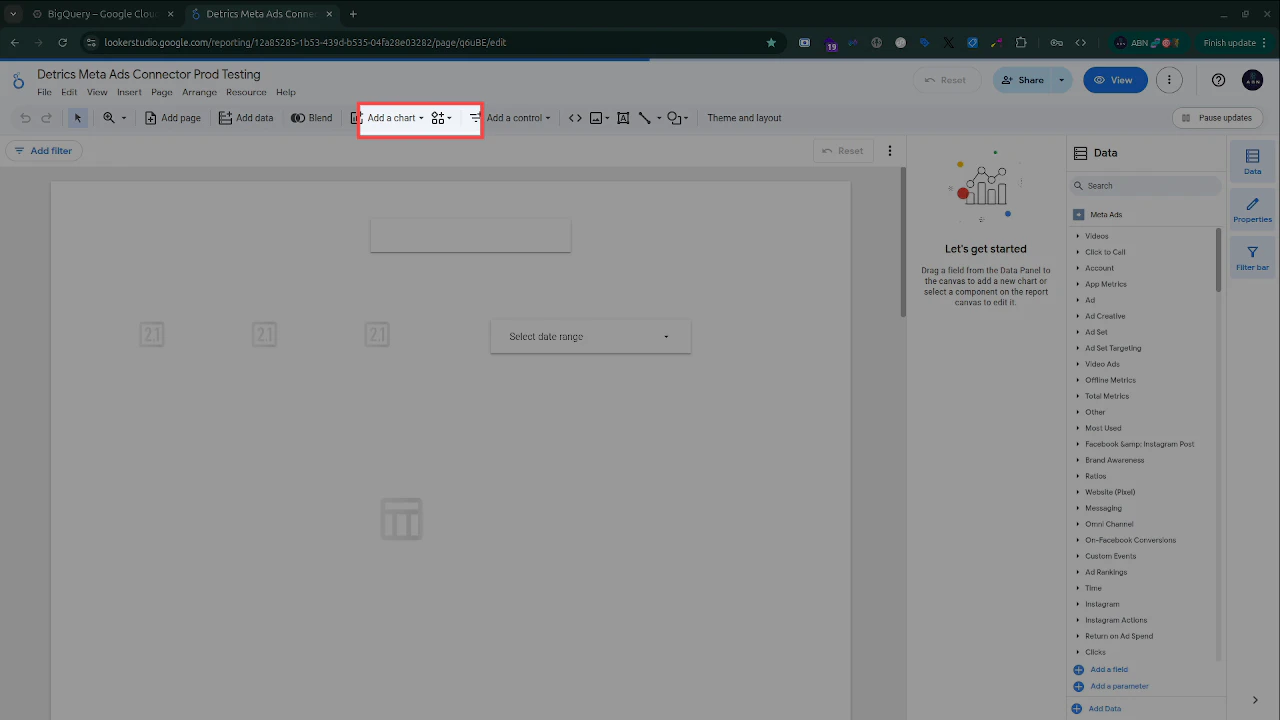
 Click **Add a chart** in the toolbar and choose a chart type (Table, Time series, Bar chart, Scorecard, etc.). The chart will appear on the canvas.
You can also drag a field directly from the Data panel onto the canvas to auto-create a chart.
Click **Add a chart** in the toolbar and choose a chart type (Table, Time series, Bar chart, Scorecard, etc.). The chart will appear on the canvas.
You can also drag a field directly from the Data panel onto the canvas to auto-create a chart.
 After adding a table chart, click it to select it. In the properties panel, drag fields from the Data panel into the **Dimension** and **Metric** slots (or use the "Add dimension" / "Add metric" buttons). Your table will populate with live data.
Here you can see campaign names, dates, and cost data pulled directly from Meta Ads.
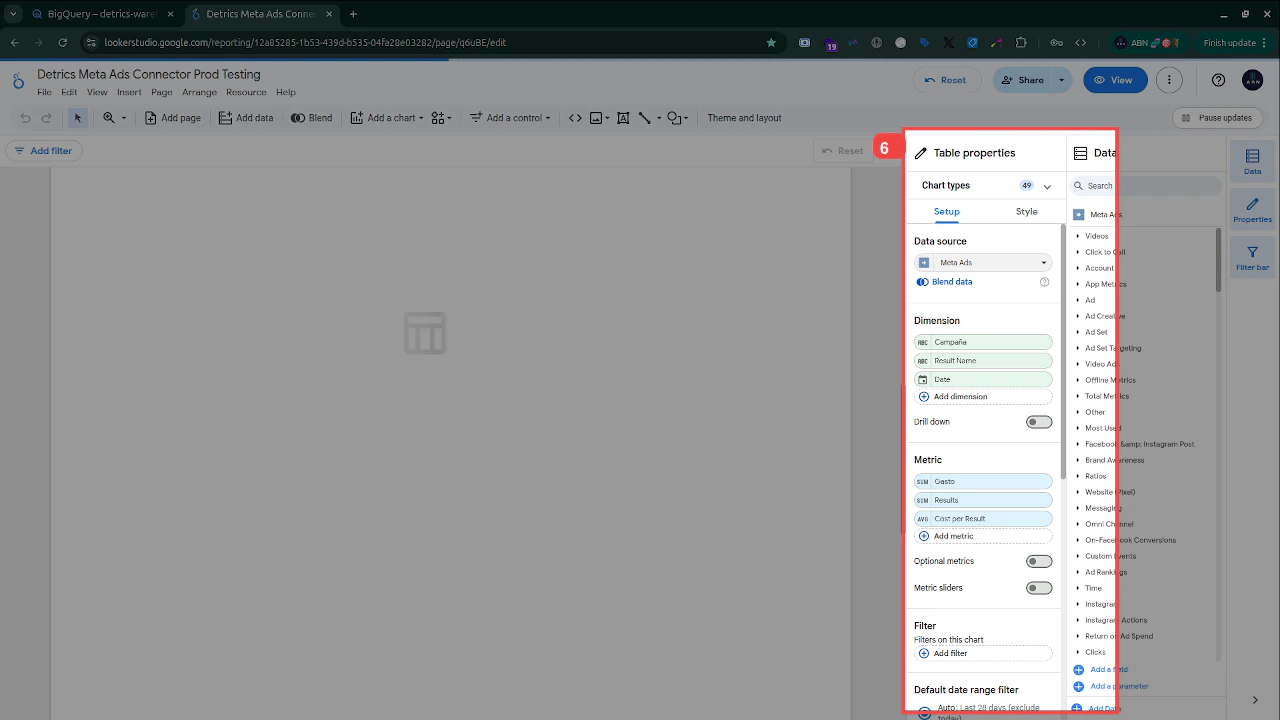
Click any chart to open its **Table properties** panel. Here you can:
* Change the **Data source** (e.g., Meta Ads)
* Add or remove **Dimensions** (like Campaign Name, Date, Result Name)
* Add or remove **Metrics** (like Cost, Results, Cost per Result)
* Set **Filters** and **Default date range**
After adding a table chart, click it to select it. In the properties panel, drag fields from the Data panel into the **Dimension** and **Metric** slots (or use the "Add dimension" / "Add metric" buttons). Your table will populate with live data.
Here you can see campaign names, dates, and cost data pulled directly from Meta Ads.
Click any chart to open its **Table properties** panel. Here you can:
* Change the **Data source** (e.g., Meta Ads)
* Add or remove **Dimensions** (like Campaign Name, Date, Result Name)
* Add or remove **Metrics** (like Cost, Results, Cost per Result)
* Set **Filters** and **Default date range**
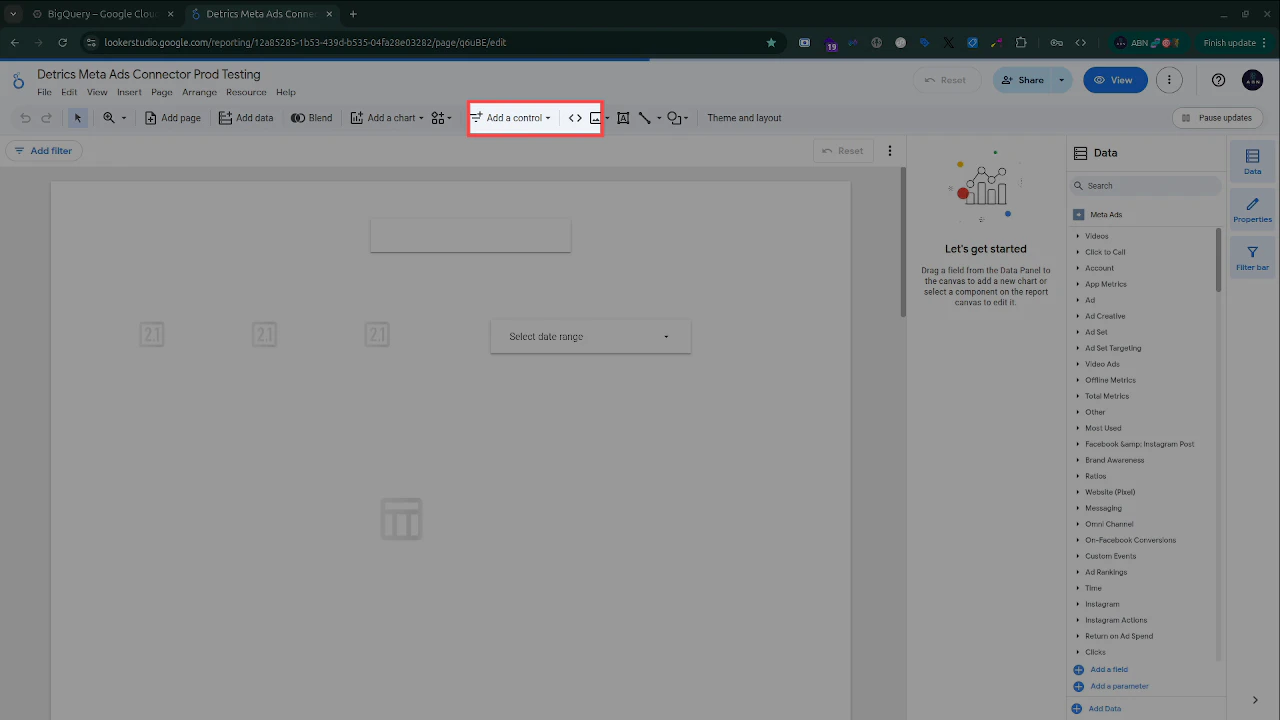
 Click **Add a control** in the toolbar and select **Date range control**. Place it on your report canvas. This lets viewers filter all charts by a custom date range.
 Once placed, you will see a date range dropdown on your report canvas where users can select their desired date range.
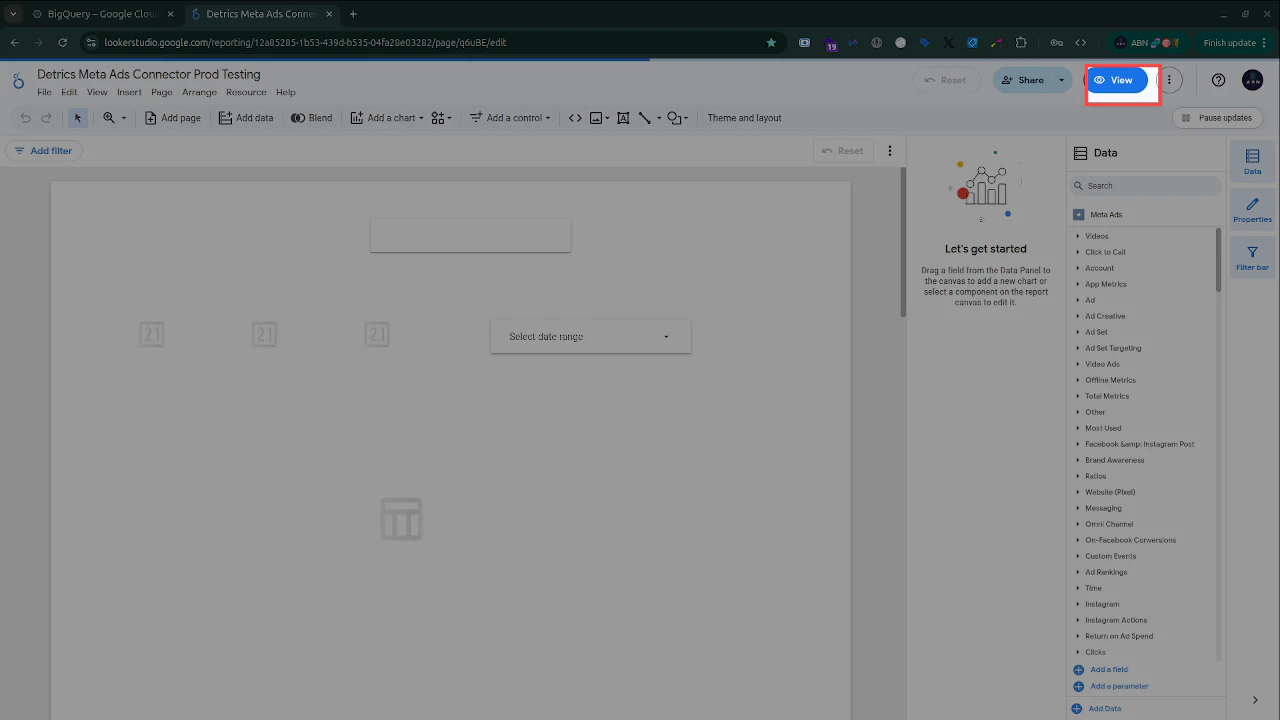
Click the **View** button (blue button in the top-right corner) to exit edit mode and see your finished report as viewers will see it. Your dashboard is now pulling live data from Detrics.
Once placed, you will see a date range dropdown on your report canvas where users can select their desired date range.
Click the **View** button (blue button in the top-right corner) to exit edit mode and see your finished report as viewers will see it. Your dashboard is now pulling live data from Detrics.
 Your 14-day free trial starts once your first table loads data in Looker Studio.
Looker Studio has a **6-minute execution limit** per data source query. If your report times out, reduce the date range or number of fields. See the [6-minute limit guide](/data-destination/looker-studio/6-minutes-limit) for details.
## Next steps
Detailed walkthrough of the connector authorization and account selection flow
Performance tips to speed up your dashboard creation workflow
See which platforms are available as Looker Studio connectors
Solutions for common connection and performance issues
**Need help?** Reach out to [support@detrics.io](mailto:support@detrics.io) for assistance with connectors or available metrics.
Your 14-day free trial starts once your first table loads data in Looker Studio.
Looker Studio has a **6-minute execution limit** per data source query. If your report times out, reduce the date range or number of fields. See the [6-minute limit guide](/data-destination/looker-studio/6-minutes-limit) for details.
## Next steps
Detailed walkthrough of the connector authorization and account selection flow
Performance tips to speed up your dashboard creation workflow
See which platforms are available as Looker Studio connectors
Solutions for common connection and performance issues
**Need help?** Reach out to [support@detrics.io](mailto:support@detrics.io) for assistance with connectors or available metrics.