> ## Documentation Index
> Fetch the complete documentation index at: https://support.detrics.io/llms.txt
> Use this file to discover all available pages before exploring further.
# Add the Detrics Connector
> Step-by-step guide to adding Detrics as a data source in Looker Studio
**Last updated:** March 21, 2026
This guide walks through every step of adding a Detrics connector to Looker Studio, from finding the connector to seeing your data in a live report.
## Two ways to add the connector
You can add Detrics to Looker Studio in two ways:
1. **From the Detrics website** (recommended for first-time users)
2. **From within Looker Studio** (if you already have a report open)
***
## Option 1: From the Detrics website
Go to [detrics.io/looker-studio/integrations](https://www.detrics.io/looker-studio/integrations?utm_source=detrics-support\&utm_medium=looker-add-connector) and browse the available connectors.
You will see connectors for Meta Ads, Google Ads, TikTok Ads, LinkedIn Ads, Google Analytics 4, Shopify, and more.
Click on the platform you want to connect. For example, click **Meta Ads** to add Facebook/Instagram advertising data.
This will redirect you to Looker Studio's connector authorization page.
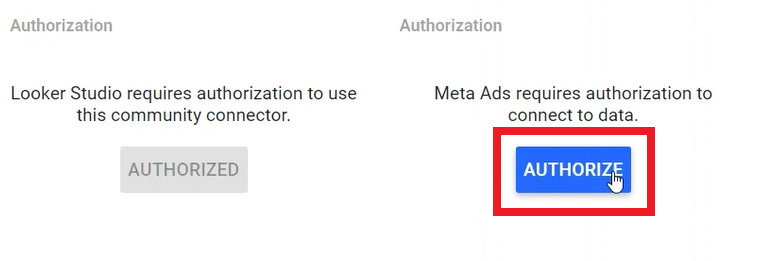
You will see two authorization steps:
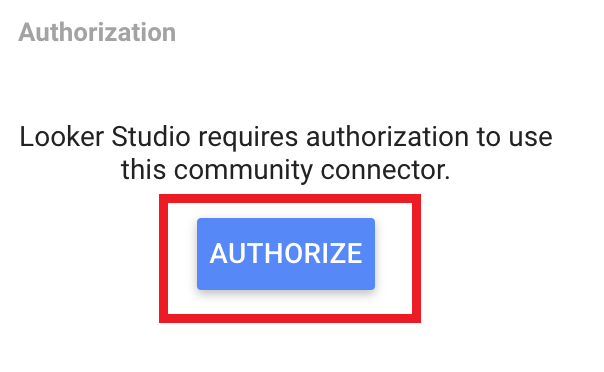
1. Click the **Authorize** button on the left side to sign in with your Google account
2. Click the **Authorize** button on the right side to connect your ad platform
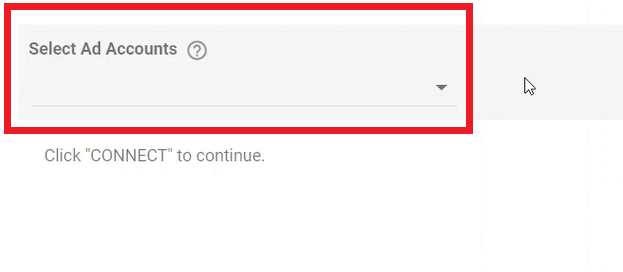
 Choose the specific account you want to pull data from. For Meta Ads, you will see a dropdown listing all your ad accounts.
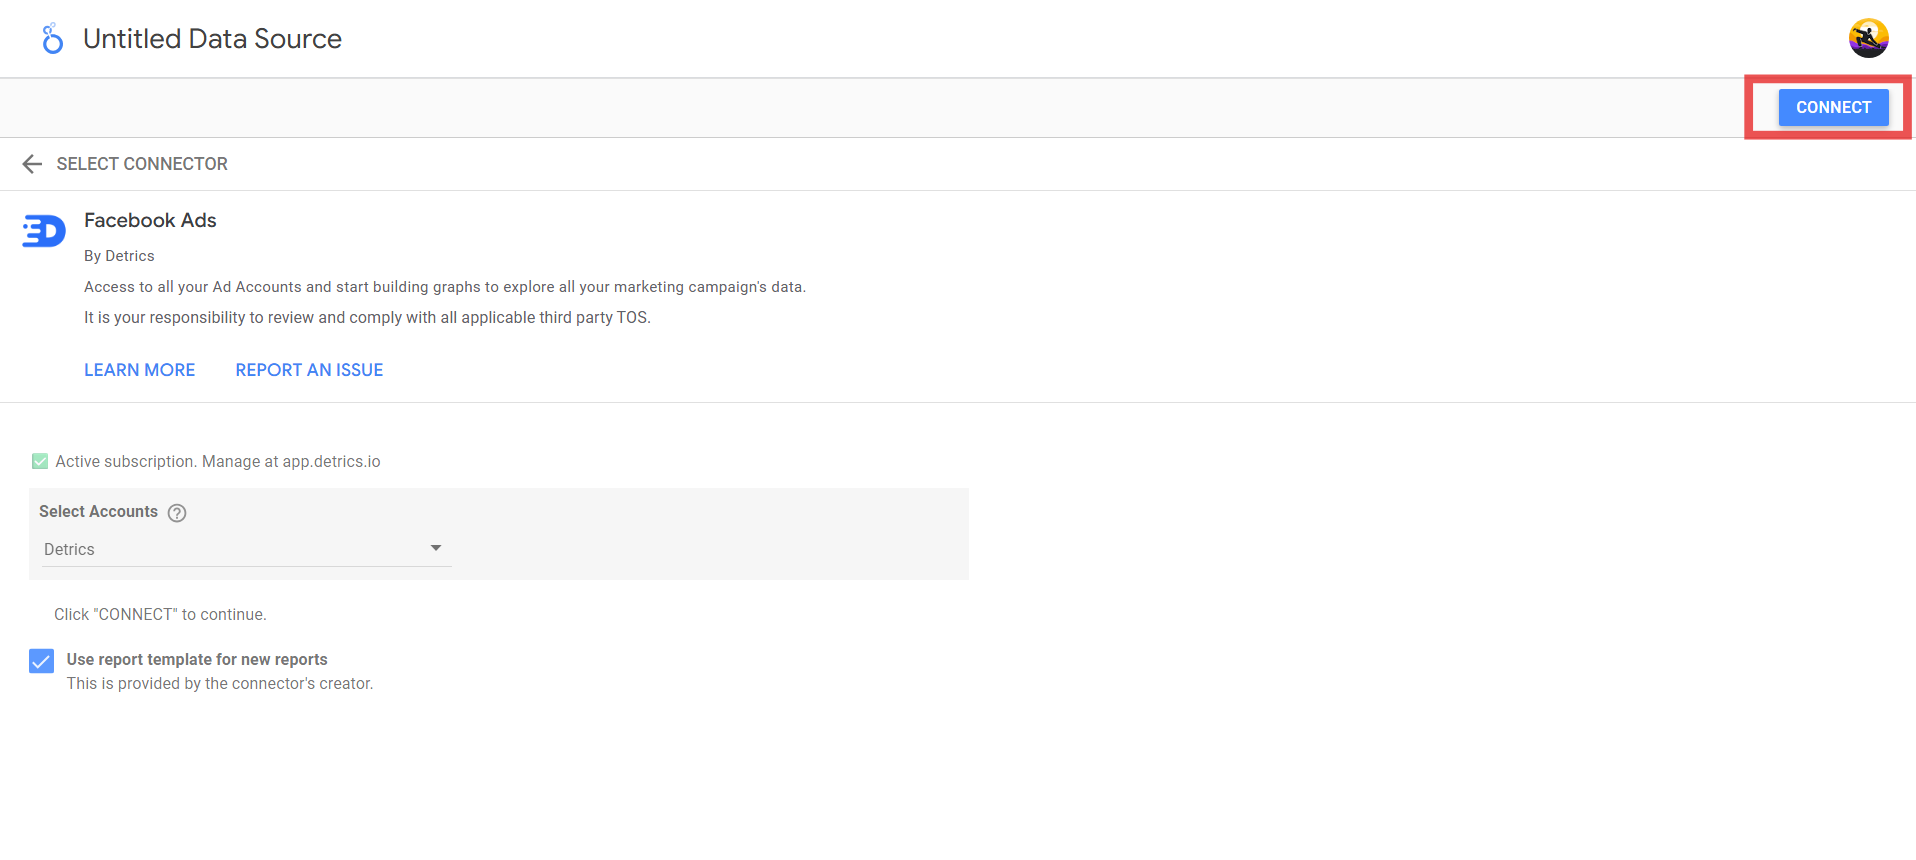
 Some connectors offer pre-built templates with common charts and layouts already configured. Keep the checkbox checked to start with a template, or uncheck it to start from a blank report.
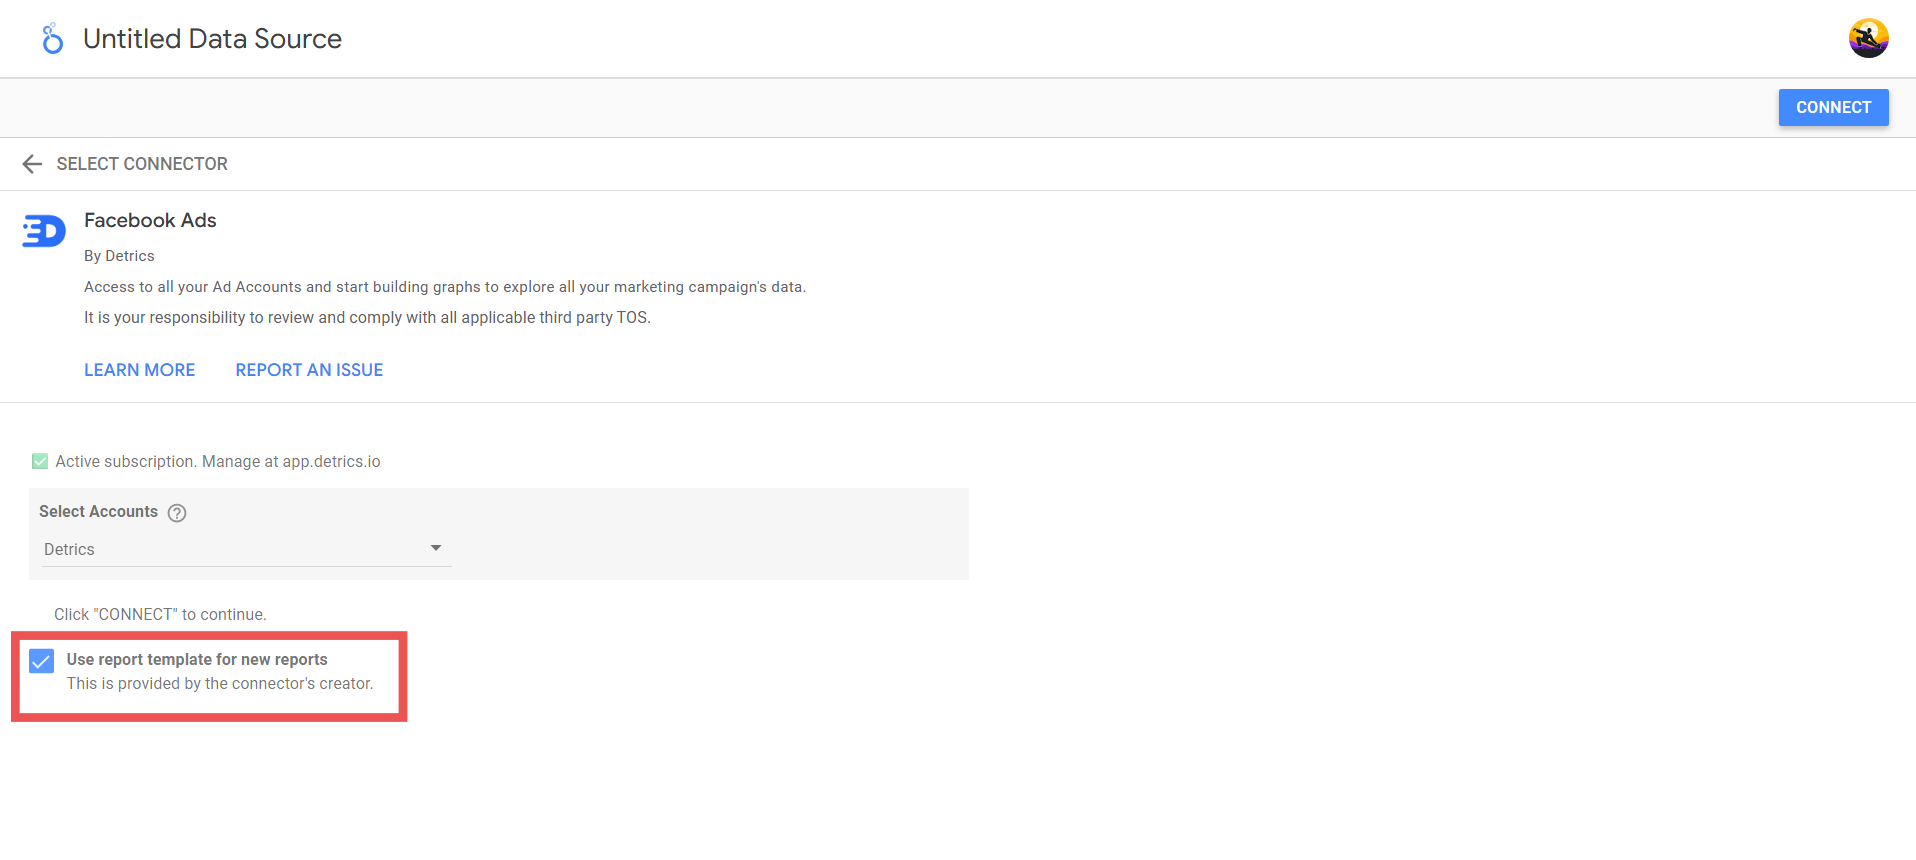 Templates are a great starting point. You can always customize or remove any element after the report is created.
Click the **Connect** button in the top-right corner of the screen to finalize the connection.
Templates are a great starting point. You can always customize or remove any element after the report is created.
Click the **Connect** button in the top-right corner of the screen to finalize the connection.
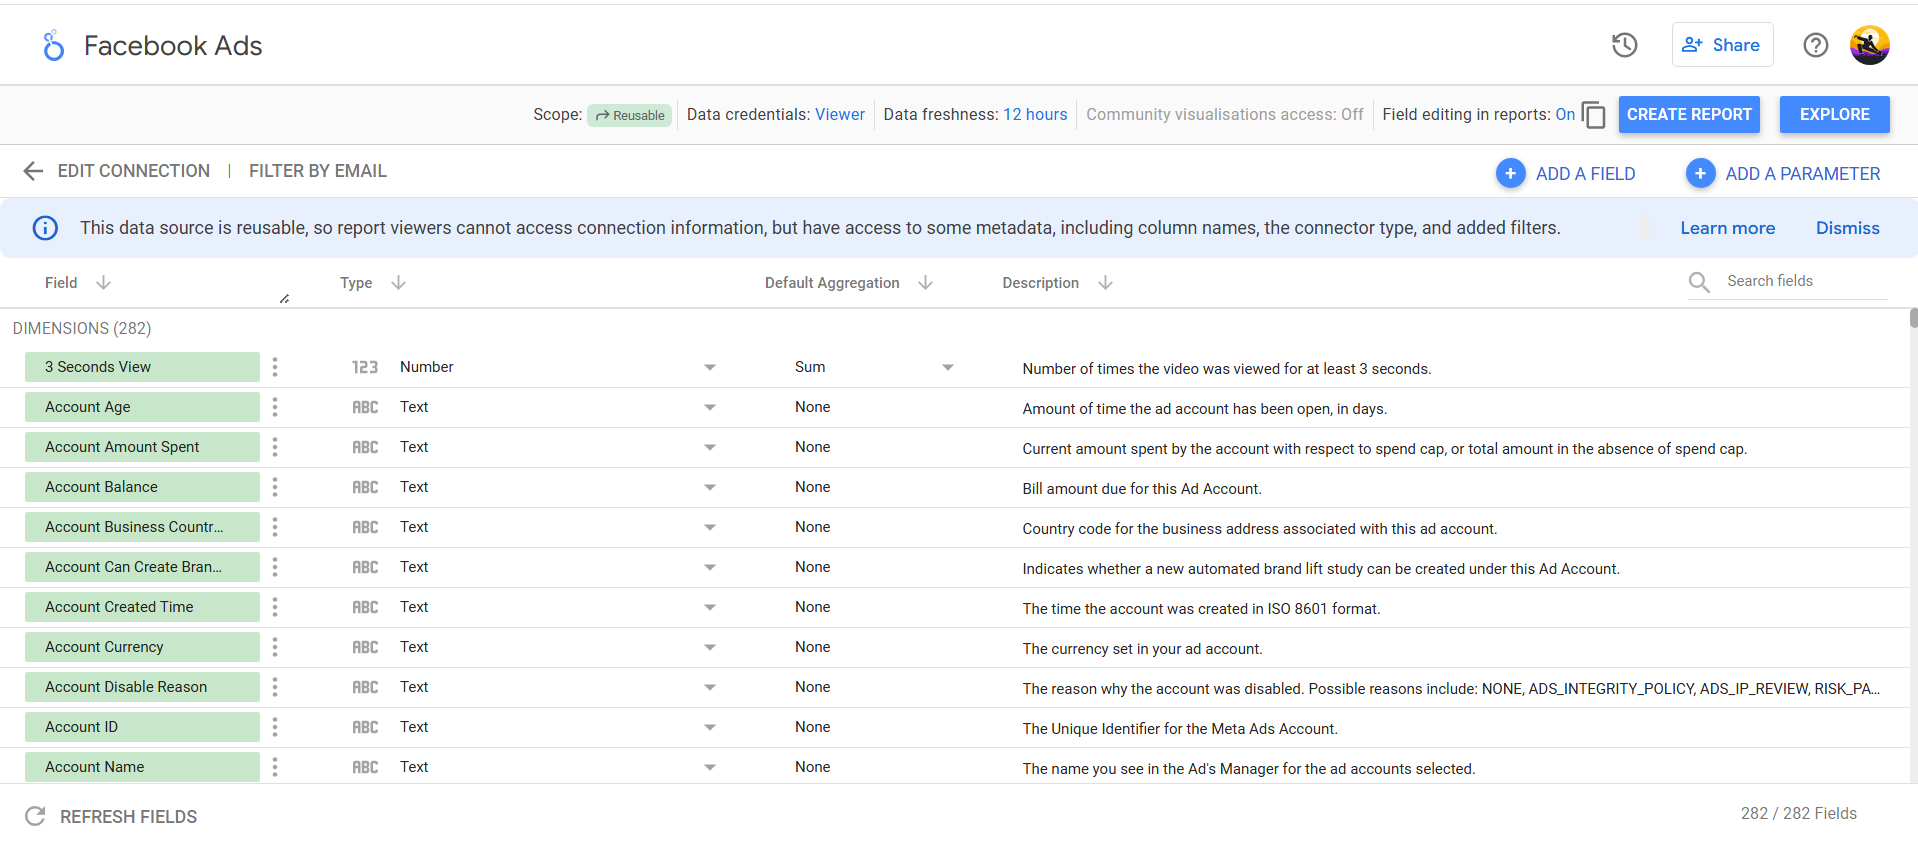
 Before creating the report, you can review the available fields. A common adjustment is changing the "Ad Image" field type from **Text** to **Image URL** so your report can display ad creative previews.
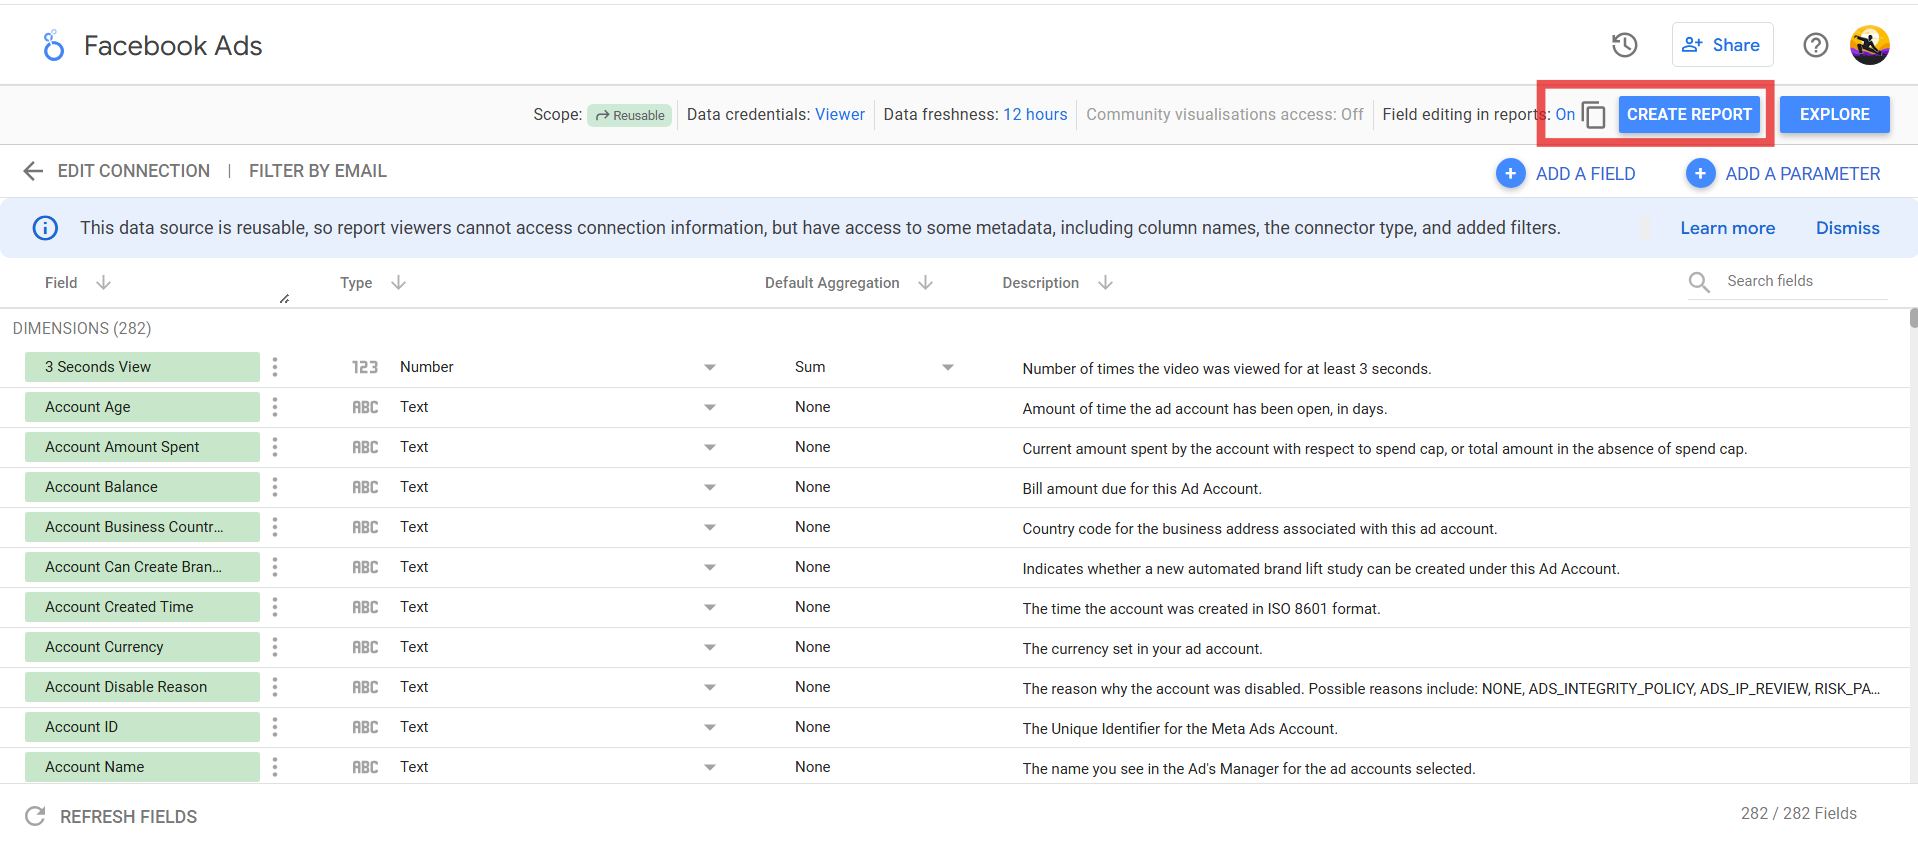
 Click **Create Report** (or **Add to Report** if adding to an existing report). Your data source is now connected and ready to use.
 ***
## Option 2: From within Looker Studio
If you already have a report open in edit mode, you can add Detrics as an additional data source.
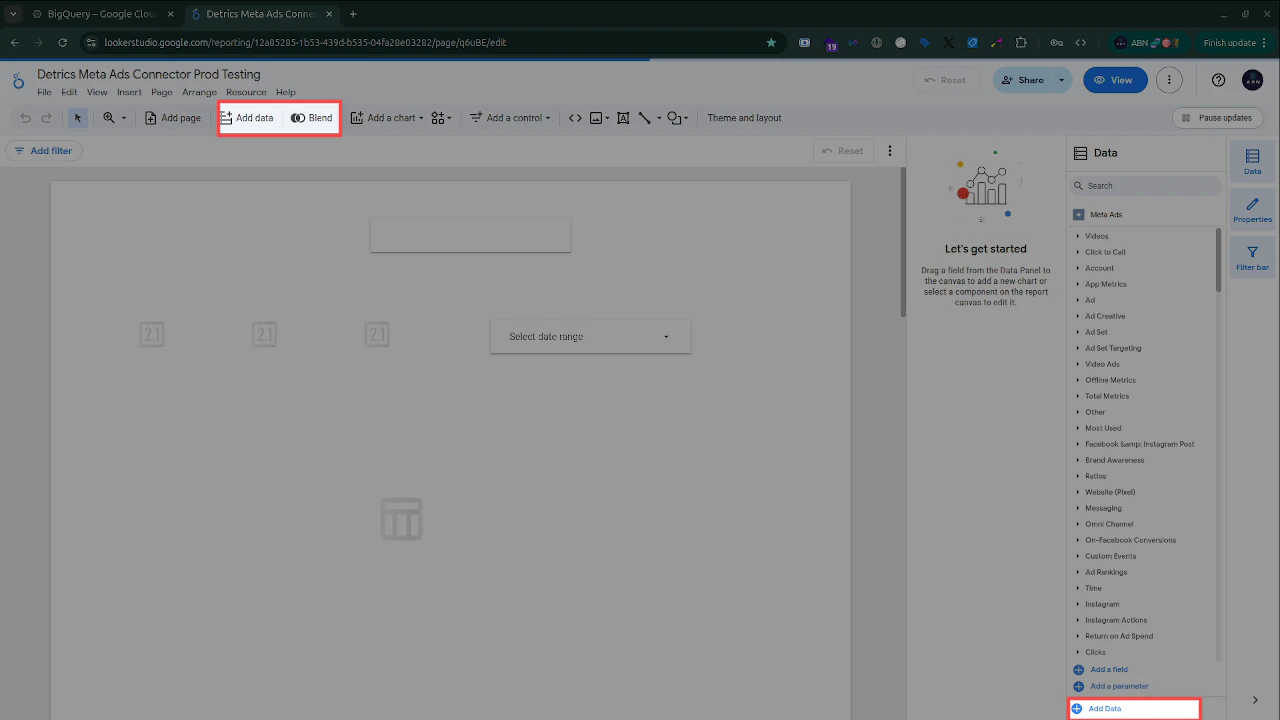
In edit mode, click **Add data** in the toolbar at the top of the screen, or click the **Add Data** link at the bottom of the Data panel on the right side.
***
## Option 2: From within Looker Studio
If you already have a report open in edit mode, you can add Detrics as an additional data source.
In edit mode, click **Add data** in the toolbar at the top of the screen, or click the **Add Data** link at the bottom of the Data panel on the right side.
 In the connector search dialog, type **Detrics**. You will see all available Detrics connectors listed. Select the one matching your platform.
Follow the same authorization flow as Option 1 above (Steps 3-4). You will authorize your Google account, then your platform account, and select the specific ad account.
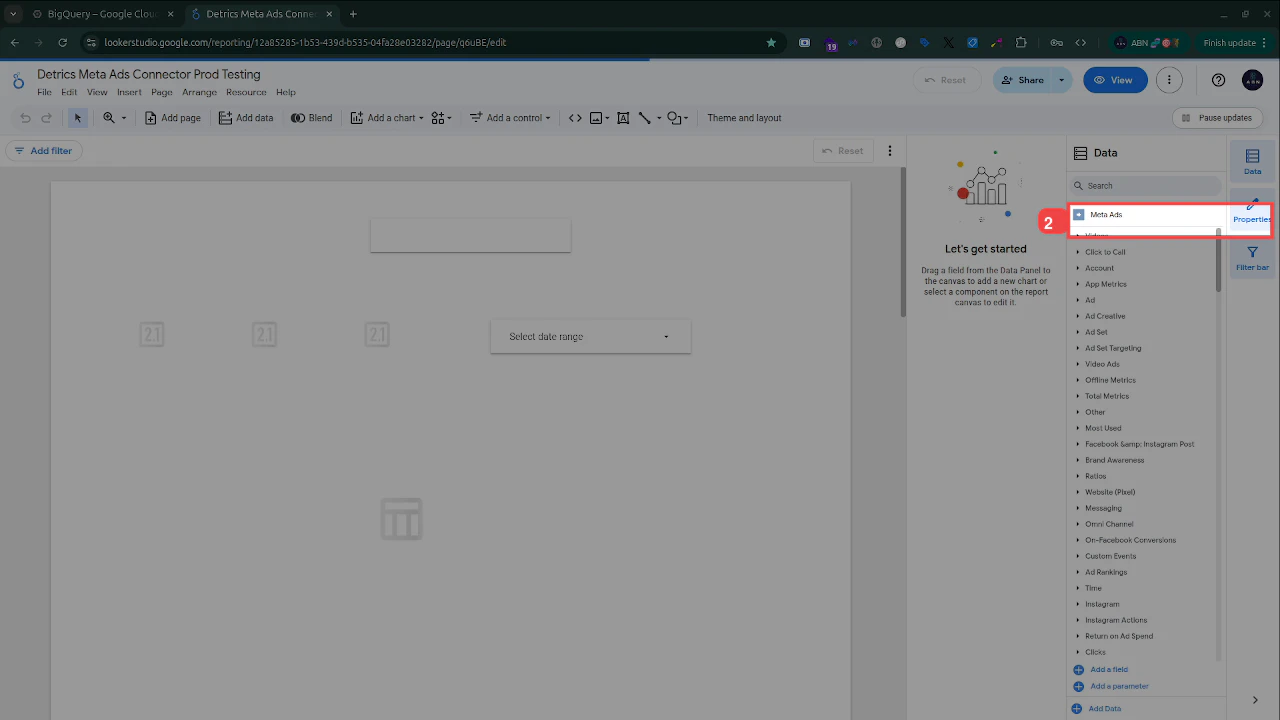
Once connected, you will see the data source appear in the Data panel on the right, showing the platform name (e.g., "Meta Ads") and all available field categories.
In the connector search dialog, type **Detrics**. You will see all available Detrics connectors listed. Select the one matching your platform.
Follow the same authorization flow as Option 1 above (Steps 3-4). You will authorize your Google account, then your platform account, and select the specific ad account.
Once connected, you will see the data source appear in the Data panel on the right, showing the platform name (e.g., "Meta Ads") and all available field categories.
 ***
## What you see after connecting
Once your connector is set up and you have added charts, your report will display live data from your ad platform. Here is an example report with two data tables pulling campaign performance data from Meta Ads:
## Switching accounts on an existing connector
If you need to change which ad account a connector uses:
1. Go to **Resource > Manage added data sources**
2. Find the Detrics connector and click **Edit**
3. Change the account selection
4. Click **Reconnect** in the top-right corner
## Available connectors
Detrics currently supports the following platforms as Looker Studio connectors:
* **Meta (Facebook) Ads**
* **Google Ads**
* **TikTok Ads**
* **LinkedIn Ads**
* **X (Twitter) Ads**
* **Bing (Microsoft) Ads**
* **Google Display & Video 360**
* **Google Analytics 4**
* **Instagram Insights**
* **Shopify**
For the full list with field details, see [Supported Data Sources](/data-destination/looker-studio/supported-data-sources).
## Troubleshooting connection issues
Make sure you are searching for **Detrics** (not "Dataplug"). If it still does not appear, try using the [direct link from the Detrics website](https://www.detrics.io/looker-studio/integrations?utm_source=detrics-support\&utm_medium=looker-add-connector-troubleshooting) instead.
Clear your browser cookies for `lookerstudio.google.com` and try again. Make sure you are using the same Google account that has your Detrics workspace. If the issue persists, try in an incognito window.
Verify that your platform connection is active in your [Detrics workspace](https://app.detrics.io). If the connection has expired, re-authorize it in the Detrics web app first, then retry in Looker Studio.
Check the [6-minute timeout guide](/data-destination/looker-studio/6-minutes-limit). Looker Studio has a strict execution time limit. Try reducing your date range or the number of fields in your query.
Each Looker Studio connector instance is tied to a single ad account. To pull data from multiple accounts, add the connector once per account using **Add data**.
## Next steps
Full walkthrough of building your first report
Tips to speed up your dashboard workflow
Understand Looker Studio's query timeout and how to work around it
Solutions for common issues
**Need help?** Reach out to [support@detrics.io](mailto:support@detrics.io) for assistance with connection issues or missing platforms.
***
## What you see after connecting
Once your connector is set up and you have added charts, your report will display live data from your ad platform. Here is an example report with two data tables pulling campaign performance data from Meta Ads:
## Switching accounts on an existing connector
If you need to change which ad account a connector uses:
1. Go to **Resource > Manage added data sources**
2. Find the Detrics connector and click **Edit**
3. Change the account selection
4. Click **Reconnect** in the top-right corner
## Available connectors
Detrics currently supports the following platforms as Looker Studio connectors:
* **Meta (Facebook) Ads**
* **Google Ads**
* **TikTok Ads**
* **LinkedIn Ads**
* **X (Twitter) Ads**
* **Bing (Microsoft) Ads**
* **Google Display & Video 360**
* **Google Analytics 4**
* **Instagram Insights**
* **Shopify**
For the full list with field details, see [Supported Data Sources](/data-destination/looker-studio/supported-data-sources).
## Troubleshooting connection issues
Make sure you are searching for **Detrics** (not "Dataplug"). If it still does not appear, try using the [direct link from the Detrics website](https://www.detrics.io/looker-studio/integrations?utm_source=detrics-support\&utm_medium=looker-add-connector-troubleshooting) instead.
Clear your browser cookies for `lookerstudio.google.com` and try again. Make sure you are using the same Google account that has your Detrics workspace. If the issue persists, try in an incognito window.
Verify that your platform connection is active in your [Detrics workspace](https://app.detrics.io). If the connection has expired, re-authorize it in the Detrics web app first, then retry in Looker Studio.
Check the [6-minute timeout guide](/data-destination/looker-studio/6-minutes-limit). Looker Studio has a strict execution time limit. Try reducing your date range or the number of fields in your query.
Each Looker Studio connector instance is tied to a single ad account. To pull data from multiple accounts, add the connector once per account using **Add data**.
## Next steps
Full walkthrough of building your first report
Tips to speed up your dashboard workflow
Understand Looker Studio's query timeout and how to work around it
Solutions for common issues
**Need help?** Reach out to [support@detrics.io](mailto:support@detrics.io) for assistance with connection issues or missing platforms.