> ## Documentation Index
> Fetch the complete documentation index at: https://support.detrics.io/llms.txt
> Use this file to discover all available pages before exploring further.
# How to build dashboards 10x faster in Looker Studio
> Performance optimization techniques to dramatically speed up your dashboard creation workflow
**Last updated:** August 12, 2025
Building dashboards in Looker Studio can be frustratingly slow if you don't know these critical performance techniques. By following these simple strategies, you can reduce your dashboard creation time by up to 90%.
## The #1 Performance Killer: Live Data Updates
Every time you add a new chart, modify a table, add columns, or make any change to your dashboard, Looker Studio automatically fetches fresh data from the connector's servers. This constant data fetching is the primary reason why dashboard building feels slow.
**Without optimization**: Each change triggers a data fetch that can take 5-30 seconds depending on your data source and volume.
**With optimization**: Changes are instant, allowing you to iterate rapidly.
## Strategy 1: Pause Auto-Refresh (Most Important!)
The single most impactful optimization is to pause data updates while building your dashboard.
### How to Pause Updates:
Find the refresh icon in the top toolbar of Looker Studio
Click the refresh icon and select "Pause auto-refresh"
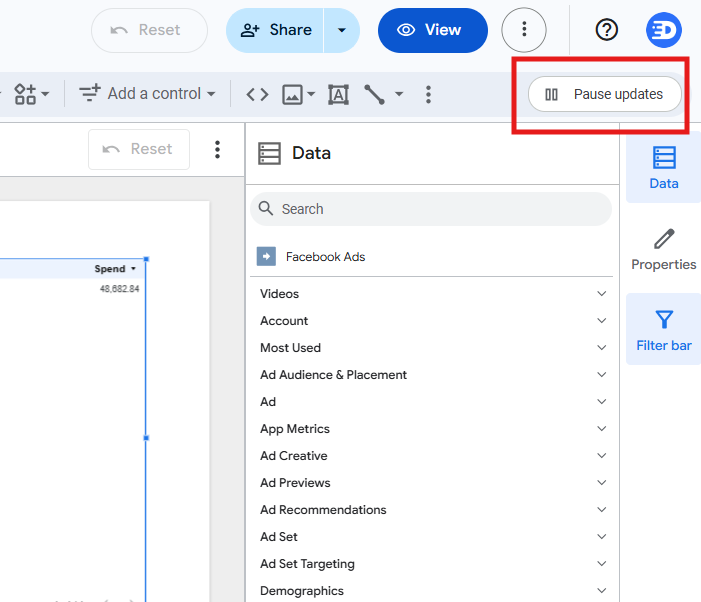 Now you can:
* Add new charts instantly
* Modify table columns without waiting
* Adjust filters and date ranges immediately
* Rearrange components freely
* Change chart types on the fly
Only resume auto-refresh when you're ready to test with real data
**Pro tip**: Keep auto-refresh paused during your entire building session. Only enable it when you need to verify the final result or test specific functionality.
## Strategy 2: Use Minimal Date Ranges
While building your dashboard, limit the amount of data being processed by using the smallest possible date range.
### Implementation:
1. **Add a date range control** to your dashboard immediately
2. **Set it to "Yesterday"** or "Last 7 days" while building
Now you can:
* Add new charts instantly
* Modify table columns without waiting
* Adjust filters and date ranges immediately
* Rearrange components freely
* Change chart types on the fly
Only resume auto-refresh when you're ready to test with real data
**Pro tip**: Keep auto-refresh paused during your entire building session. Only enable it when you need to verify the final result or test specific functionality.
## Strategy 2: Use Minimal Date Ranges
While building your dashboard, limit the amount of data being processed by using the smallest possible date range.
### Implementation:
1. **Add a date range control** to your dashboard immediately
2. **Set it to "Yesterday"** or "Last 7 days" while building
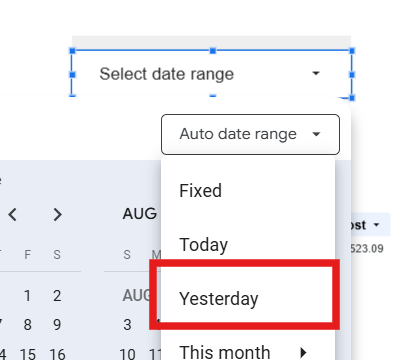 3. **Why this works**:
* Yesterday's data = 1 day of processing
* Last 30 days = 30x more data to process
* Last year = 365x more data to process
Using yesterday's data is particularly effective because:
* It's a complete dataset (unlike "today" which is partial)
* It loads extremely fast (minimal data volume)
* It's recent enough to show realistic patterns
## Performance Comparison
Here's what you can expect with these optimizations:
| Action | Without Optimization | With Optimization | Time Saved |
| ------------------- | -------------------- | ----------------- | ---------- |
| Adding a new chart | 10-30 seconds | Instant | 95-100% |
| Adding table column | 5-15 seconds | Instant | 95-100% |
| Changing chart type | 10-20 seconds | Instant | 95-100% |
| Applying filter | 5-20 seconds | Instant | 95-100% |
**Time saved**: Following these strategies, a dashboard that normally takes 2-3 hours to build can be completed in 15-30 minutes.
Questions about performance or need help optimizing your dashboards? Contact [support@detrics.io](mailto:support@detrics.io)
3. **Why this works**:
* Yesterday's data = 1 day of processing
* Last 30 days = 30x more data to process
* Last year = 365x more data to process
Using yesterday's data is particularly effective because:
* It's a complete dataset (unlike "today" which is partial)
* It loads extremely fast (minimal data volume)
* It's recent enough to show realistic patterns
## Performance Comparison
Here's what you can expect with these optimizations:
| Action | Without Optimization | With Optimization | Time Saved |
| ------------------- | -------------------- | ----------------- | ---------- |
| Adding a new chart | 10-30 seconds | Instant | 95-100% |
| Adding table column | 5-15 seconds | Instant | 95-100% |
| Changing chart type | 10-20 seconds | Instant | 95-100% |
| Applying filter | 5-20 seconds | Instant | 95-100% |
**Time saved**: Following these strategies, a dashboard that normally takes 2-3 hours to build can be completed in 15-30 minutes.
Questions about performance or need help optimizing your dashboards? Contact [support@detrics.io](mailto:support@detrics.io)